Demographic table from “demoGraphic” R package.
This is a R package I built, I just want to show you guys how to use demoGraphic package to get demographic table quickly. The Demographic Table in R combines contingency table for categorical variables, mean and standard deviation for continuous variables. t-test, chi-square test and Fisher’s exact test calculated the p-value of two groups. The standardized mean difference were performed with 95 % confident interval, and writing table into document file. . There are 3 main functions. cat_table, cont_table and demo_table. Each function return demographic table and smd value with 95% confident interval .
str(mtcars)
'data.frame': 32 obs. of 11 variables:
$ mpg : num 21 21 22.8 21.4 18.7 18.1 14.3 24.4 22.8 19.2 ...
$ cyl : num 6 6 4 6 8 6 8 4 4 6 ...
$ disp: num 160 160 108 258 360 ...
$ hp : num 110 110 93 110 175 105 245 62 95 123 ...
$ drat: num 3.9 3.9 3.85 3.08 3.15 2.76 3.21 3.69 3.92 3.92 ...
$ wt : num 2.62 2.88 2.32 3.21 3.44 ...
$ qsec: num 16.5 17 18.6 19.4 17 ...
$ vs : num 0 0 1 1 0 1 0 1 1 1 ...
$ am : num 1 1 1 0 0 0 0 0 0 0 ...
$ gear: num 4 4 4 3 3 3 3 4 4 4 ...
$ carb: num 4 4 1 1 2 1 4 2 2 4 ...
# we can see all of variables are numeric
# I am gonna convert cyl, vs, am, gear and carb to cateogorical variables
mtcars[,c("cyl","vs", "am","gear", "carb")] = lt;- lapply(mtcars[,c("cyl","vs", "am","gear", "carb")], factor)
str(mtcars)
'data.frame': 32 obs. of 11 variables:
$ mpg : num 21 21 22.8 21.4 18.7 18.1 14.3 24.4 22.8 19.2 ...
$ cyl : Factor w/ 3 levels "6","4","8": 1 1 2 1 3 1 3 2 2 1 ...
$ disp: num 160 160 108 258 360 ...
$ hp : num 110 110 93 110 175 105 245 62 95 123 ...
$ drat: num 3.9 3.9 3.85 3.08 3.15 2.76 3.21 3.69 3.92 3.92 ...
$ wt : num 2.62 2.88 2.32 3.21 3.44 ...
$ qsec: num 16.5 17 18.6 19.4 17 ...
$ vs : Factor w/ 2 levels "0","1": 1 1 2 2 1 2 1 2 2 2 ...
$ am : Factor w/ 2 levels "1","0": 1 1 1 2 2 2 2 2 2 2 ...
$ gear: Factor w/ 3 levels "4","3","5": 1 1 1 2 2 2 2 1 1 1 ...
$ carb: Factor w/ 6 levels "4","1","2","3",..: 1 1 2 2 3 2 1 3 3 1 ...
# let's take a look of table
lapply(mtcars[,c("cyl","vs", "am","gear", "carb")], function(i) table(i, useNA="ifany"))
# Let's use "am" variable is outcome, because it has 2 levels.
# Let's apply demoGraphic package
??demoGraphic
# let's check categorical variables
var = c("cyl","vs","gear", "carb")
group_var = "am"
categorical_table = cat_table(var,group_var, mtcars)
categorical_table$demo_table
categorical_table$demo_table
Variable 0 1 p value smd
1 cyl n (%)
2 4 3 (15.79) 8 (61.54) 0.009 1.251
3 6 4 (21.05) 3 (23.08)
4 8 12 (63.16) 2 (15.38)
5 vs n (%)
6 0 12 (63.16) 6 (46.15) 0.473 0.347
7 1 7 (36.84) 7 (53.85)
8 gear n (%)
9 3 15 (78.95) 0 (0.00) 0.000 2.958
10 4 4 (21.05) 8 (61.54)
11 5 0 (0.00) 5 (38.46)
12 carb n (%)
13 1 3 (15.79) 4 (30.77) 0.259 0.987
14 2 6 (31.58) 4 (30.77)
15 3 3 (15.79) 0 (0.00)
16 4 7 (36.84) 3 (23.08)
17 6 0 (0.00) 1 (7.69)
18 8 0 (0.00) 1 (7.69)
# This is continuous variables
var = c("mpg","disp", "hp", "drat", "wt", "qsec")
group_var = "am"
numeric_table = cont_table(var,group_var, mtcars)
numeric_table$demo_table
Variable 0 1 p value smd
1 mpg Mean (sd) 17.15 (3.83) 24.39 (6.17) 0.001 1.411
2 disp Mean (sd) 290.38 (110.17) 143.53 (87.20) 0.000 -1.478
3 hp Mean (sd) 160.26 (53.91) 126.85 (84.06) 0.221 -0.473
4 drat Mean (sd) 3.29 (0.39) 4.05 (0.36) 0.000 2.018
5 wt Mean (sd) 3.77 (0.78) 2.41 (0.62) 0.000 -1.935
6 qsec Mean (sd) 18.18 (1.75) 17.36 (1.79) 0.209 -0.465
# now put everthing togetther
all_var = c("mpg", "cyl", "disp", "hp", "drat", "wt", "qsec", "vs","gear", "carb")
group_var = "am"
all_table = demo_table(all_var, group_var, mtcars)
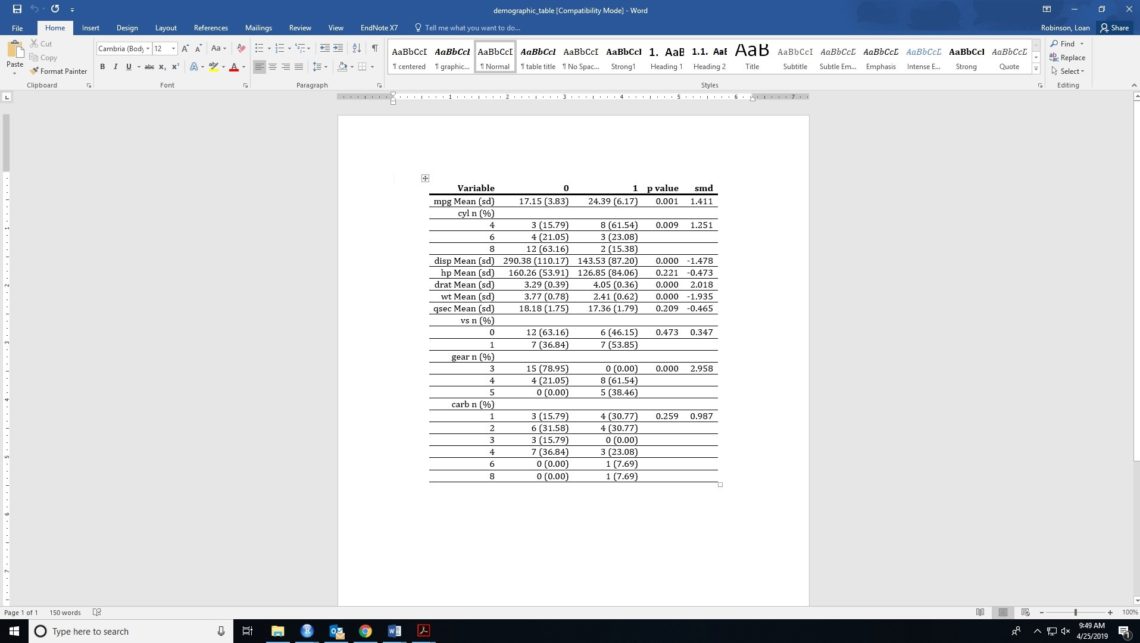
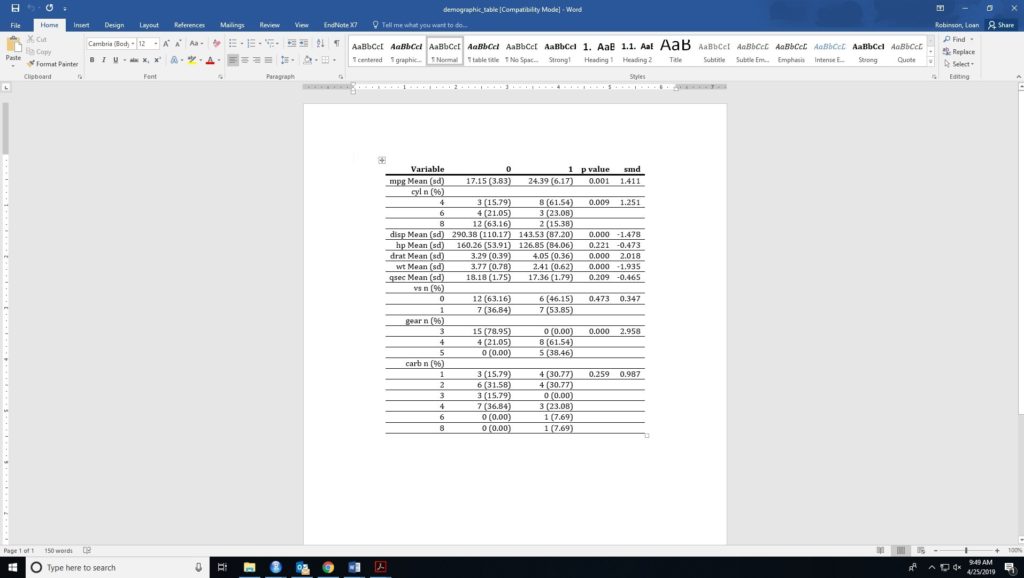
all_table$demo_table
all_table$smd_table
Variable smd.value smd.lo smd.up
1 mpg 1.4110460 0.6254189 2.1966731
2 cyl 1.2505757 0.4814381 2.0197133
3 disp -1.4780339 -2.2710199 -0.6850478
4 hp -0.4732373 -1.1881779 0.2417032
5 drat 2.0179726 1.1565019 2.8794433
6 wt -1.9349029 -2.7848568 -1.0849489
7 qsec -0.4645486 -1.1791470 0.2500498
8 vs 0.3466579 -0.3639127 1.0572284
9 gear 2.9580399 1.9466468 3.9694329
10 carb 0.9869582 0.2411924 1.7327241
# Let's write demographic table to docx file
setwd("U:/Documents/Loan Robinson")
mydocx(all_table$demo_table,"demographic_table")
[1] "U:/Documents/Loan Robinson/demographic_table.docx"
This is demographic_table looks like
2+


One Comment
Alice White
Hi there, thanks for this amazing package!!
I am getting the following error message, both with my data and the mtcars data
Error in names(x) <- value :
'names' attribute [10] must be the same length as the vector [9]
Any suggestions on how I could fix this?
Thanks again
Alice