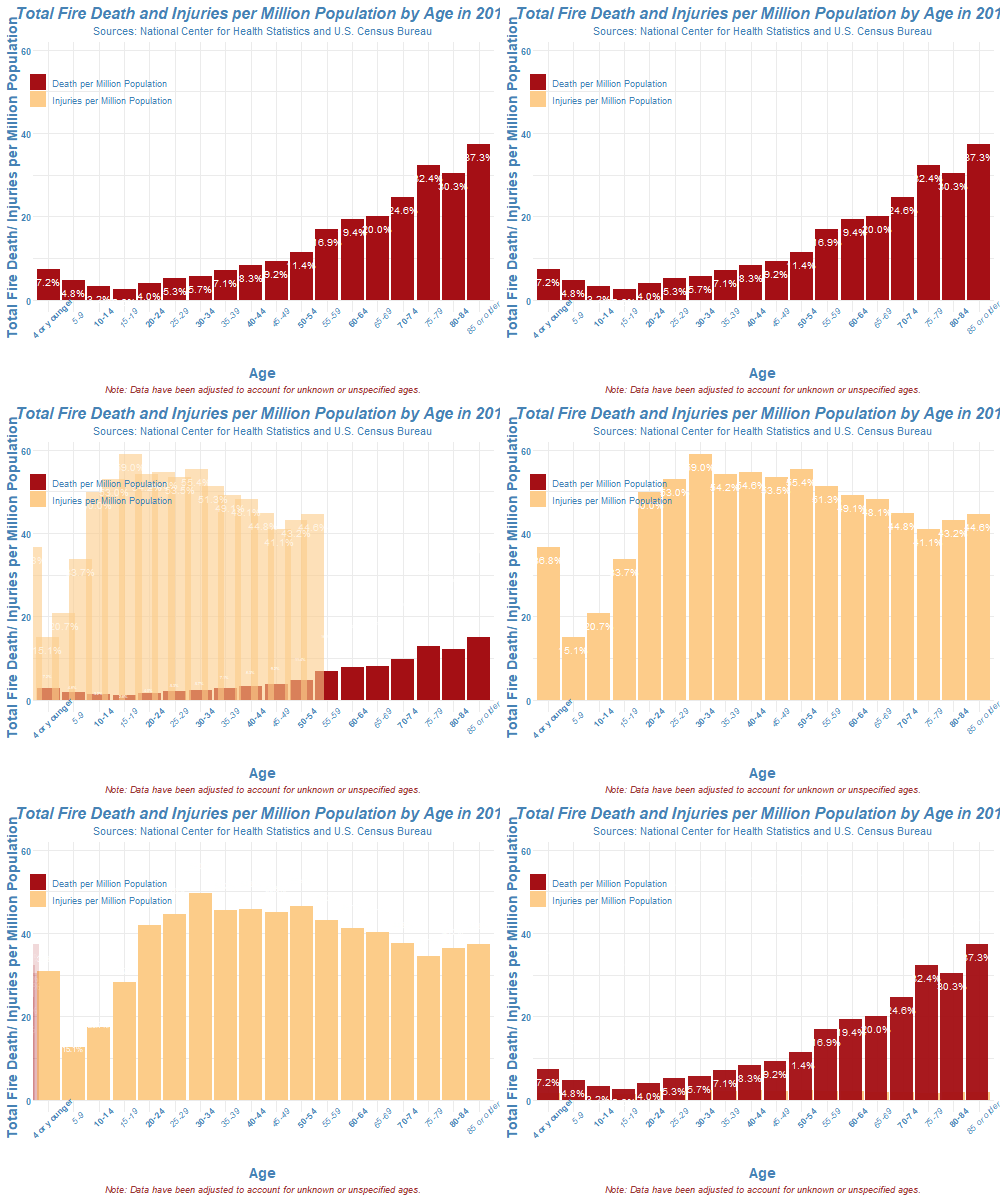
How to Create Animated Graphs in R
These libraries you need to create an animated plot. We will use data from National Center for Health Statistics and U.S. Census Bureau. You can download data here
library(ggplot2)
library(gganimate)
library(gifski)
> str(Death_Injure_Age)
'data.frame':	36 obs. of  5 variables:
 $ group  : chr  "Death" "Death" "Death" "Death" ...
 $ Age    : Factor w/ 18 levels "4 or younger",..: 1 2 3 4 5 6 7 8 9 10 ...
 $ Percent: num  4.1 2.79 1.91 1.54 2.56 ...
 $ per_mil: num  7.23 4.8 3.25 2.55 4.02 ...
 $ RR     : num  0.666 0.442 0.299 0.235 0.37 ...
Using geom_bar and geom_text to plot
ggplot(Death_Injure_Age) +
     geom_bar(aes(x = Age, y =  per_mil, fill = group, group = group),
     stat='identity', position = 'dodge') +
     geom_text(aes(x = Age, y =  per_mil,
     label = paste0(sprintf("%.1f", per_mil),"%"), group = group),
     position = position_dodge(width = 1),
     vjust = 2, size = 3.5, color = "white")
Here is the magic part to make a plot animated
transition_states(group)
# Set size and mode enter and exit
gt <- animate(p+enter_fade() + ease_aes(x = 'sine-in-out') + enter_fly(x_loc = -1) + exit_shrink() ,width = 1000, height = 800)
Then you can save it in .gif file, Here is final code for this plot. You may play around with transition, you can find more detail here
library(ggplot2)
library(gganimate)
library(gifski)
# 2. Fire and Relative Risk of Death and Injure in a Fire by Age in 2016

Death_Injure_Age <- read.csv("C:/Users/LOAN/Documents/Fire datasets 20190206/data/Death_Injure_Age_2016.csv",header = TRUE,stringsAsFactors = FALSE)
Death_Injure_Age$Age <- factor(Death_Injure_Age$Age, levels = c(unique(Death_Injure_Age$Age)))

p <- ggplot(Death_Injure_Age) +
     geom_bar(aes(x = Age, y =  per_mil, fill = group, group = group), stat='identity', position = 'dodge') +
     geom_text(aes(x = Age, y =  per_mil,
                   label = paste0(sprintf("%.1f", per_mil),"%"), group = group),
                   position = position_dodge(width = 1),
                   vjust = 2, size = 3.5, color = "white") +
     scale_fill_manual(name = "",values = c("#a50f15","#fdcc8a"),labels=c("Death per Million Population", "Injuries per Million Population "))+
     theme_minimal() + labs(title = "Total Fire Death and Injuries per Million Population by Age in 2016",
                         x = "Age",
                         y = "Total Fire Death/ Injuries per Million Population",
                         subtitle = "Sources: National Center for Health Statistics and U.S. Census Bureau",
                         caption = "Note: Data have been adjusted to account for unknown or unspecified ages.")+
  theme(axis.text.x = element_text(face=c("bold","italic"), color="steelblue",size=9, angle = 45),
        axis.text.y = element_text(face=c("bold"),color="steelblue",size=9),
        axis.text = element_text( color="steelblue"),
        plot.title = element_text(color="steelblue", size=16, face="bold.italic",hjust = 0.5),
        plot.subtitle = element_text(color="steelblue",hjust = 0.5),
        plot.caption = element_text(color="#993333",hjust = 0.5, face="italic"),
        axis.title.x = element_text(color="steelblue", size=14, face="bold",hjust = 0.5),
        axis.title.y = element_text(color="steelblue", size=14, face="bold",hjust = 0.5),
        legend.text = element_text(color="steelblue"),
        axis.ticks.length = unit(0, "cm"),legend.box = "horizontal",
        legend.position = c(0.15,0.85)) +
  # Here comes the gganimate code
  transition_states(
    group

  )
# Different size and resolution
gt <- animate(p+enter_fade() + ease_aes(x = 'sine-in-out') + enter_fly(x_loc = -1) + exit_shrink() ,width = 1000, height = 800)
anim_save(gt, interval = .2, filename = 'gt_with_fading.gif')
0


One Comment
ปั้มไลค์
Like!! Really appreciate you sharing this blog post.Really thank you! Keep writing.