How to add PNG or JPEG to your plot with ggplot2
Have you ever tried to add png or jpeg picture into you plot? Let’s try it!!!!
library(ggplot2)
library(png)
library(grid)
library(gridExtra)
m1 <- readPNG("C:/Users/LOAN/Desktop/R_logo.png")
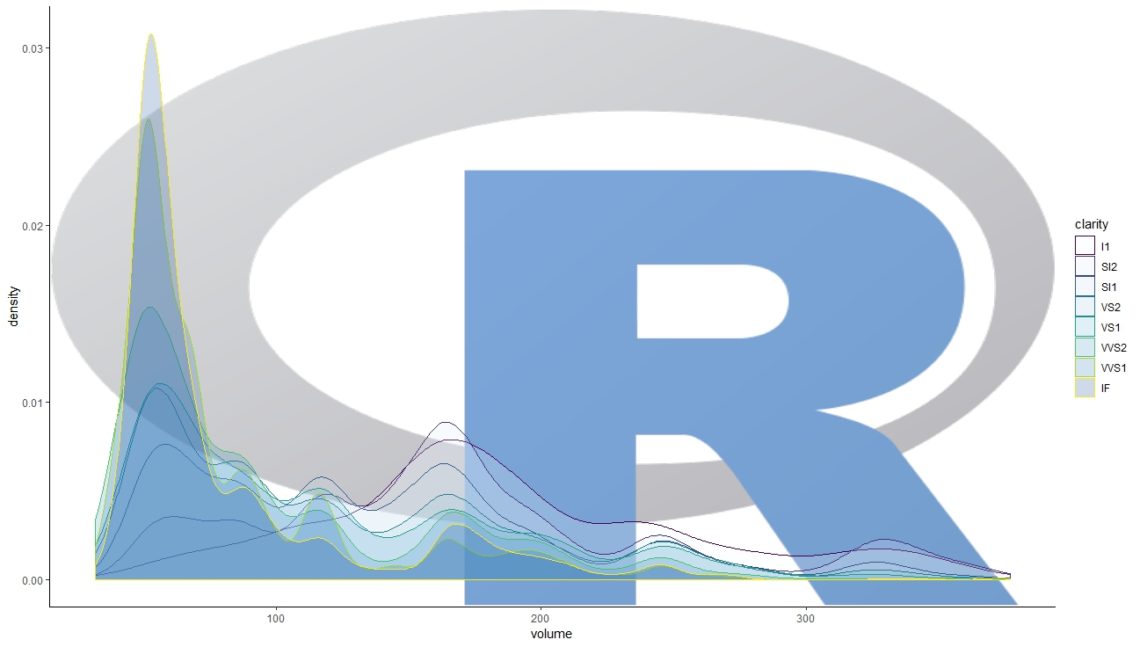
diamonds <- diamonds %>% mutate(volume = x * y *z)
diaSub <- subset(diamonds, volume <= quantile(volume, 0.995) & volume > 0)
p <- ggplot(diaSub, aes(volume, fill=clarity, group = clarity, colour = clarity)) + annotation_custom(rasterGrob(w, width=unit(1,"npc"), height=unit(1,"npc")), -Inf, Inf, -Inf, Inf)+
geom_density(alpha=.2) + theme_classic()+
scale_fill_brewer(type = 'seq',palette = "Blues")
p
1+

